
Hillshade
Following a great blog post by Ran (Novitsky) Nof on an improved matplotlib hillshading method, I decided to implement this method as well. I do it slightly differently than Ran, mainly in the way I normalize the intensity of the illumination result.
This is the hillshading code:
1
2
3
4
5
6
7
8
9
10
11
12
13
14
15
16
17
18
19
20
21
22
23
24
25
26
27
28
29
30
31
32
33
34
35
36
37
38
39
40
41
42
43
44
45
46
47
48
49
50
51
52
53
54
55
56
57
58
59
60
61
62
63
64
65
66
67
68
69
70
71
72
73
74
75
import numpy as np
from scipy.ndimage import uniform_filter

def calc_intensity(relief, azimuth=315., altitude=45.,
                   scale=None, smooth=None, normalize=False):
    """
    Calculate the illumination intensity of ``relief``.

    Can be used as to create a shaded relief map and GMT style draping
    of data.

    It is assumed that the grid origin is at the upper-left corner.
    If that is not the case, add 90 to ``azimuth``.

    This function produces similar results to the
    :meth:`~matplotlib.colors.LightSource.hillshade` method of
    matplotlib but gives extra control in terms of how the result is
    normalized.

    Parameters
    ----------
    relief : a 2d :class:`~numpy.ndarray`
        Topography or other data to calculate intensity from.

    azimuth : float
        Direction of light source, degrees from north.

    altitude : float
        Height of light source, degrees above the horizon.

    scale : float
        Scaling value of the data.

    smooth : float
        Number of cells to average before intensity calculation.

    normalize : bool or float
        By default the intensity is clipped to the [0,1] range. If set
        to ``True``, intensity is normalized to [0,1]. Otherwise, give a
        float value to normalize to [0,1] and multiply by the value
        before clipping to [0,1]. If ``normalize`` > 1, illumination
        becomes brighter and if < 1 illumination becomes darker.

    Returns
    -------
    intensity : :class:`~numpy.ndarray`
        a 2d array with illumination in the [0,1] range.
        Same size as ``relief``.
    """

    relief = relief.copy()

    if scale is not None:
        relief = relief * scale
    if smooth:
        relief = uniform_filter(relief, size=smooth)

    dzdy, dzdx = np.gradient(relief)

    slope = 0.5 * np.pi - np.arctan(np.sqrt(dzdx**2 + dzdy**2))

    aspect = np.arctan2(dzdx, dzdy)

    altitude = np.radians(altitude)
    azimuth = np.radians((azimuth - 90) % 360)

    intensity = (np.sin(altitude) * np.sin(slope) +
                 np.cos(altitude) * np.cos(slope) *
                 np.cos(-azimuth - 0.5 * np.pi - aspect))

    if normalize:
        intensity = (normalize *
                     (intensity - intensity.min()) / intensity.ptp())

    return intensity.clip(0, 1)
Generate some sample data:
1
2
3
4
5
6
7
def sample_data(rmin=-30, rmax=30, n=100):
    x, y = np.meshgrid(np.linspace(rmin, rmax, n),
                       np.linspace(rmin, rmax, n))

    r = np.sqrt(x**2 + y**2)
    data = 10 * np.cos(2 * np.pi * r / 8) * np.exp(-r / 10) + 1 * y
    return data + np.random.rand(*data.shape) - 0.5
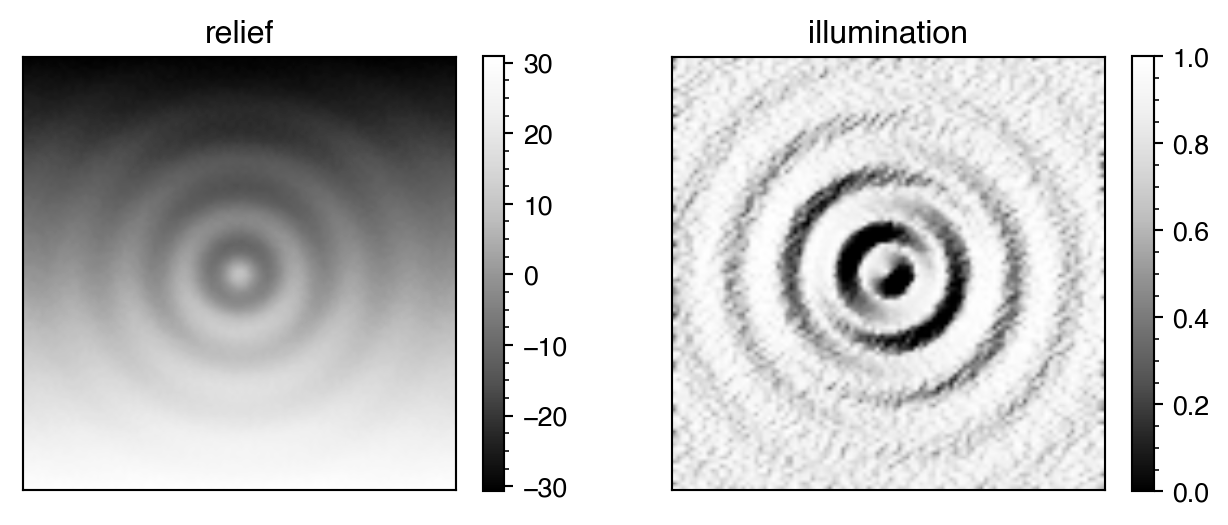
Plot relief and illumination
1
2
3
4
5
6
7
8
9
10
11
12
13
14
15
16
17
18
19
20
21
22
import matplotlib.pyplot as plt

data = sample_data()

fig, ax = plt.subplots(ncols=2, figsize=(8,3))

im = ax[0].imshow(data, interpolation='bilinear', cmap='Greys_r')
ax[0].set_title('relief')
plt.colorbar(im, ax=ax[0])

# calculate illumination intensity using default values
illumination = calc_intensity(data)

im = ax[1].imshow(illumination,
                  interpolation='bilinear', cmap='Greys_r',
                  vmin=0, vmax=1)
ax[1].set_title('illumination')
plt.colorbar(im, ax=ax[1])

for ax_ in ax:
    ax_.set_xticks([])
    ax_.set_yticks([])
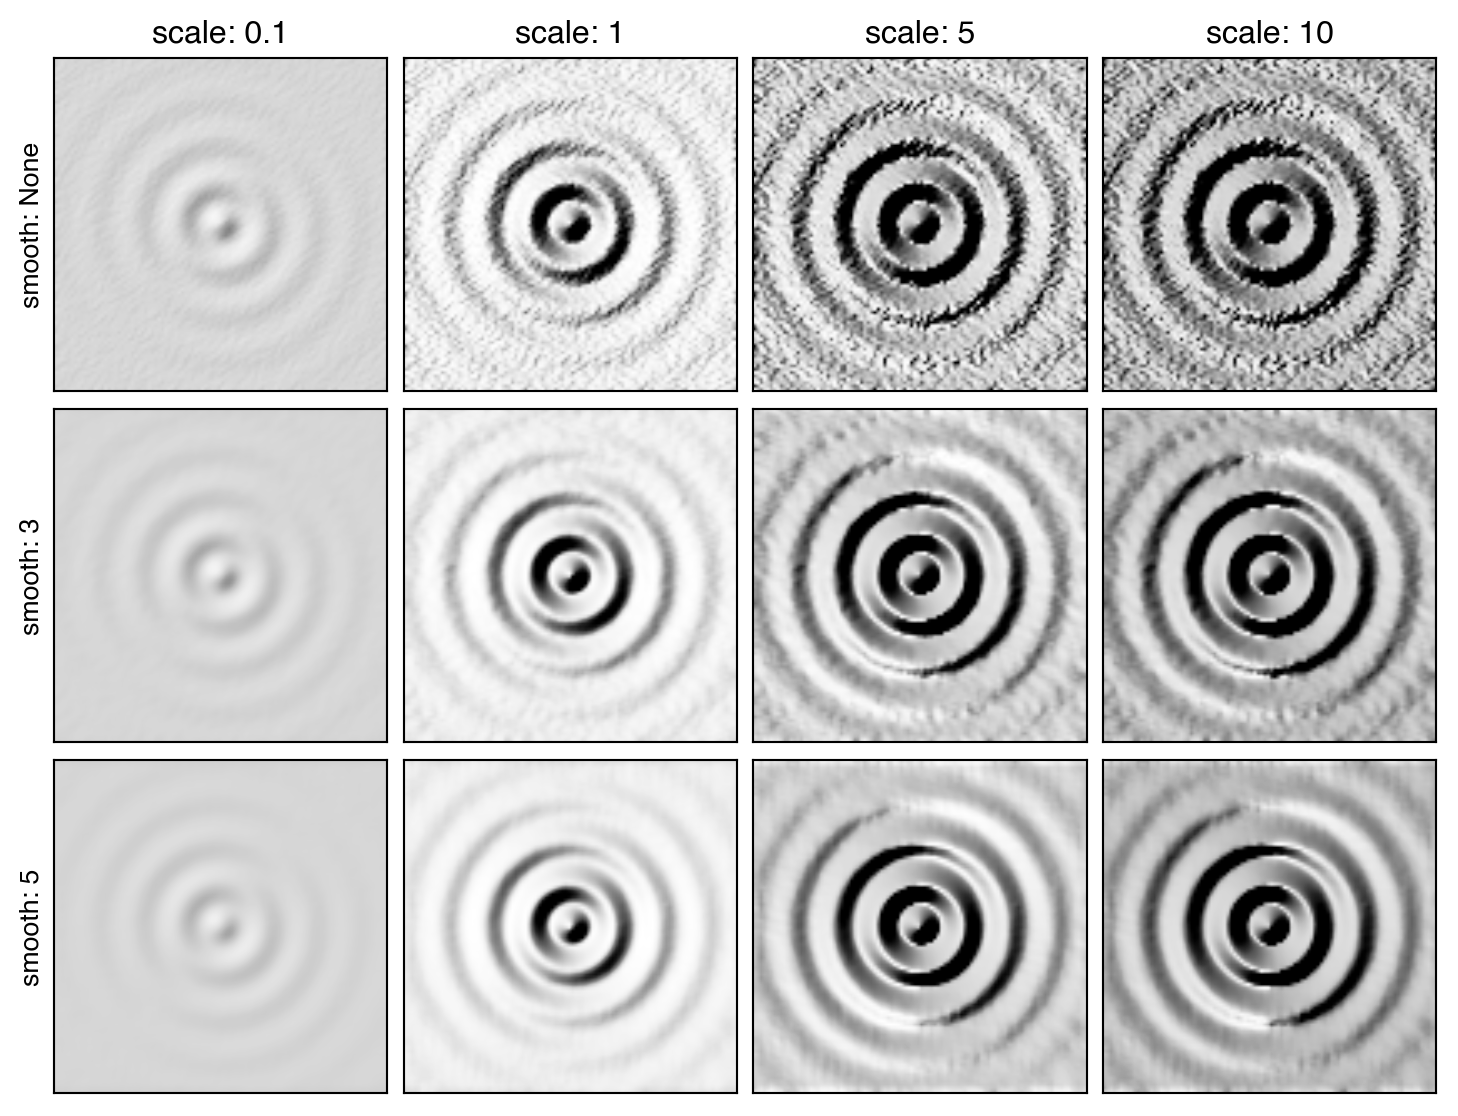
Different scale and smooth parameters
1
2
3
4
5
6
7
8
9
10
11
12
13
14
15
16
17
18
19
20
21
22
23
from itertools import product

scale = (0.1, 1, 5, 10)
smooth = (None, 3, 5)

fig, ax = plt.subplots(len(smooth), len(scale),
                       figsize=(2 * len(scale), 2 * len(smooth)))
fig.subplots_adjust(left=0.1, bottom=0, right=1, top=0.9,
                    wspace=0.05, hspace=0.05)

for i, ((smooth_, scale_), ax_) in enumerate(zip(product(smooth, scale),
                                                 ax.flat)):
    # calculate illumination intensity with scale and smooth params
    illumination = calc_intensity(data, scale=scale_, smooth=smooth_)
    ax_.imshow(illumination,
               interpolation='bilinear', cmap='Greys_r',
               vmin=0, vmax=1)
    ax_.set_xticks([])
    ax_.set_yticks([])
    if i < len(scale):
        ax_.set_title('scale: {}'.format(scale_), fontsize=12)
    if i % len(scale) == 0:
        ax_.set_ylabel('smooth: {}'.format(smooth_))
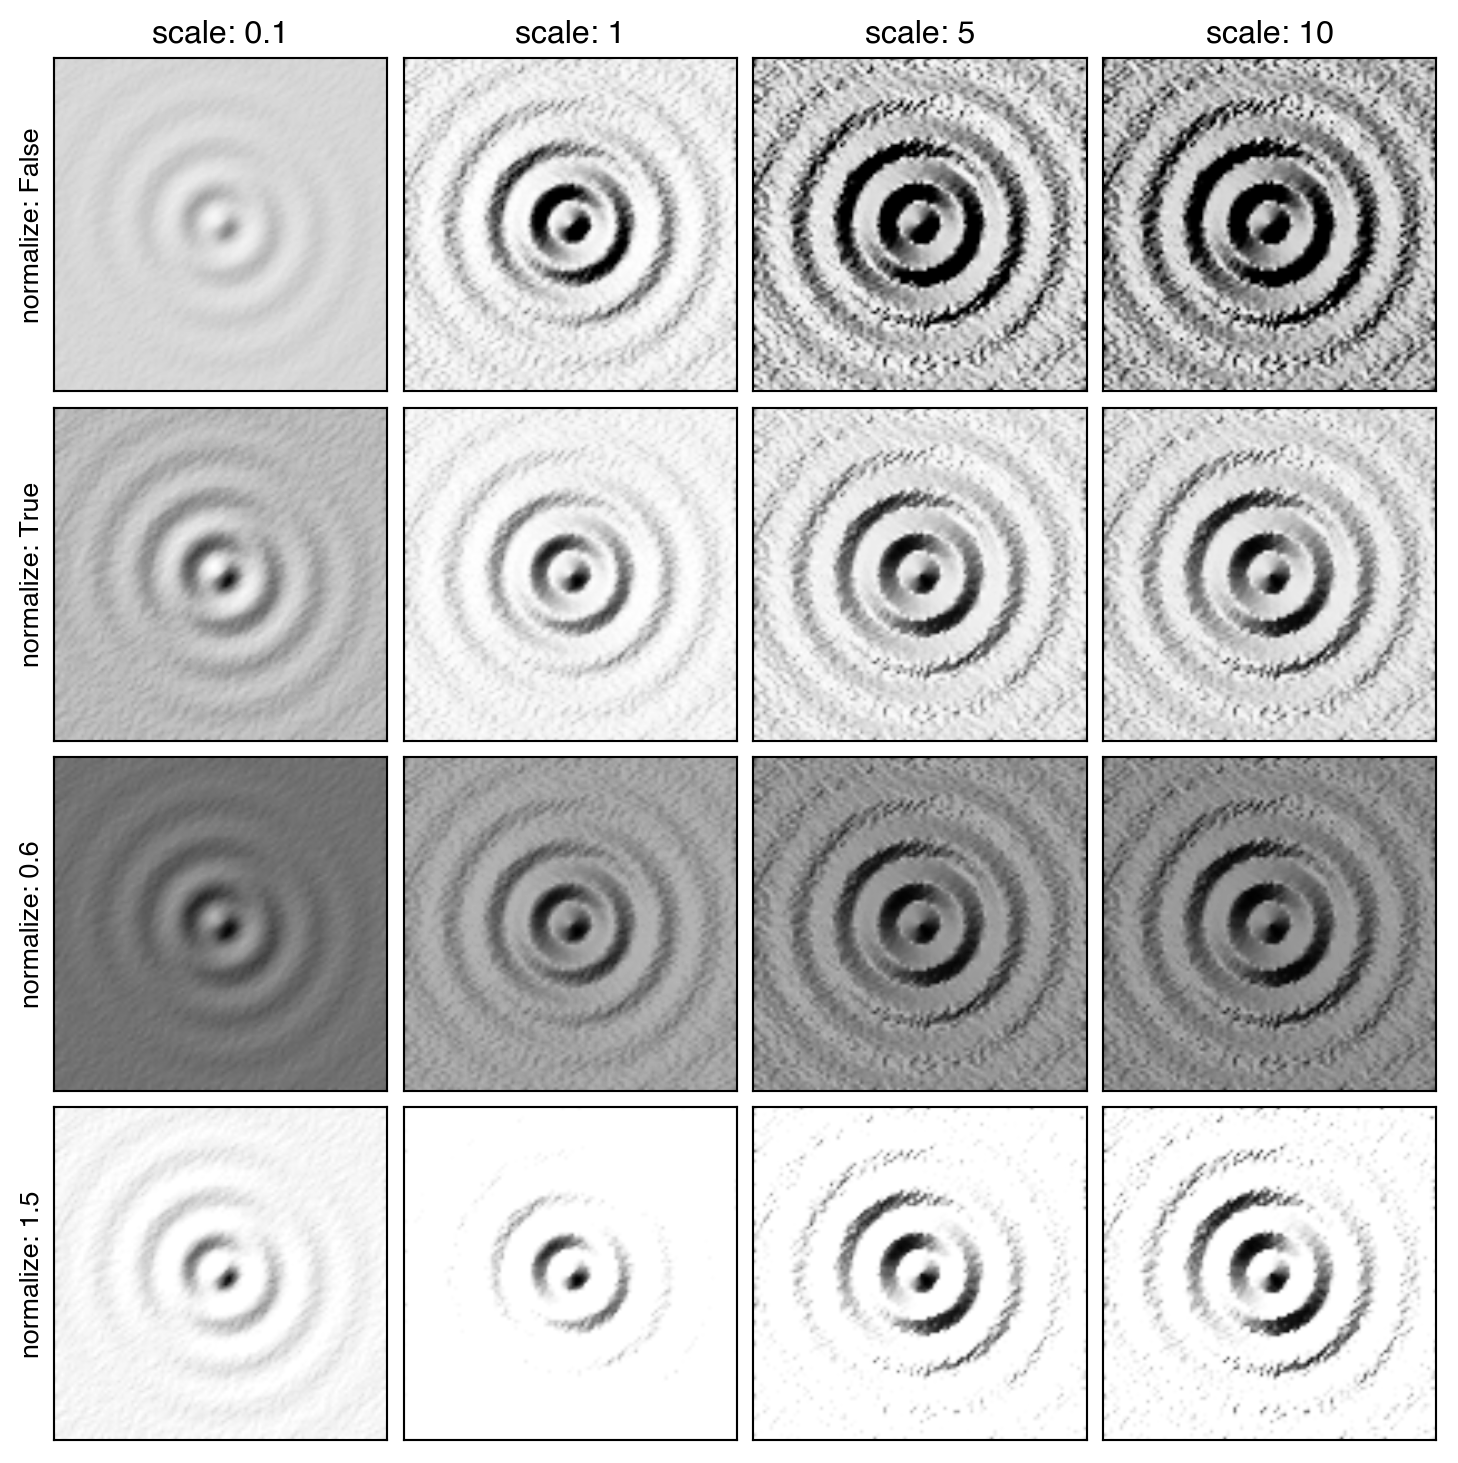
Different scale and normalization parameters
1
2
3
4
5
6
7
8
9
10
11
12
13
14
15
16
17
18
19
20
21
scale = (0.1, 1, 5, 10)
normalize = (False, True, 0.6, 1.5)

fig, ax = plt.subplots(len(normalize), len(scale),
                       figsize=(2 * len(scale), 2 * len(normalize)))
fig.subplots_adjust(left=0.1, bottom=0, right=1, top=0.9,
                    wspace=0.05, hspace=0.05)

for i, ((normalize_, scale_), ax_) in enumerate(zip(product(normalize, scale),
                                                 ax.flat)):
    # calculate illumination intensity with scale and normalize params
    illumination = calc_intensity(data, scale=scale_, normalize=normalize_)
    ax_.imshow(illumination,
               interpolation='bilinear', cmap='Greys_r',
               vmin=0, vmax=1)
    ax_.set_xticks([])
    ax_.set_yticks([])
    if i < len(scale):
        ax_.set_title('scale: {}'.format(scale_), fontsize=12)
    if i % len(scale) == 0:
        ax_.set_ylabel('normalize: {}'.format(normalize_))
Leave a Comment